by Vincent Garcia
Understanding the FIFA Quality Programme for Football Turf
FIFA Quality and FIFA Quality Pro are the two primary certification tiers within FIFA’s Quality Programme for Football Turf, the industry’s most recognized third-party standard for artificial football surfaces. Field owners, architects, and specifiers frequently encounter these terms in bids and product literature, but the distinction between the two, and what certification actually verifies, is often misunderstood. This article breaks down what each tier means, what gets tested, and how to use certification status as one input in a broader evaluation, not a standalone guarantee.
The Three Tiers of the FIFA Quality Programme
- FIFA Basic. Introduced to replace the older IMS (International Match Standard) designation. Focused on cost-effective durability and safety for lower-intensity applications.
- FIFA Quality. Designed for community, school, and municipal-level use, supporting higher weekly play volumes (up to roughly 40–60 hours per week per FIFA’s test manual) with a softer playing surface than the Pro tier.
- FIFA Quality Pro. The highest tier, designed for professional and international competition. Requires more stringent testing, tighter performance tolerances, and greater durability, including abrasion resistance roughly double that required at the Quality tier.
What FIFA Certification Actually Tests
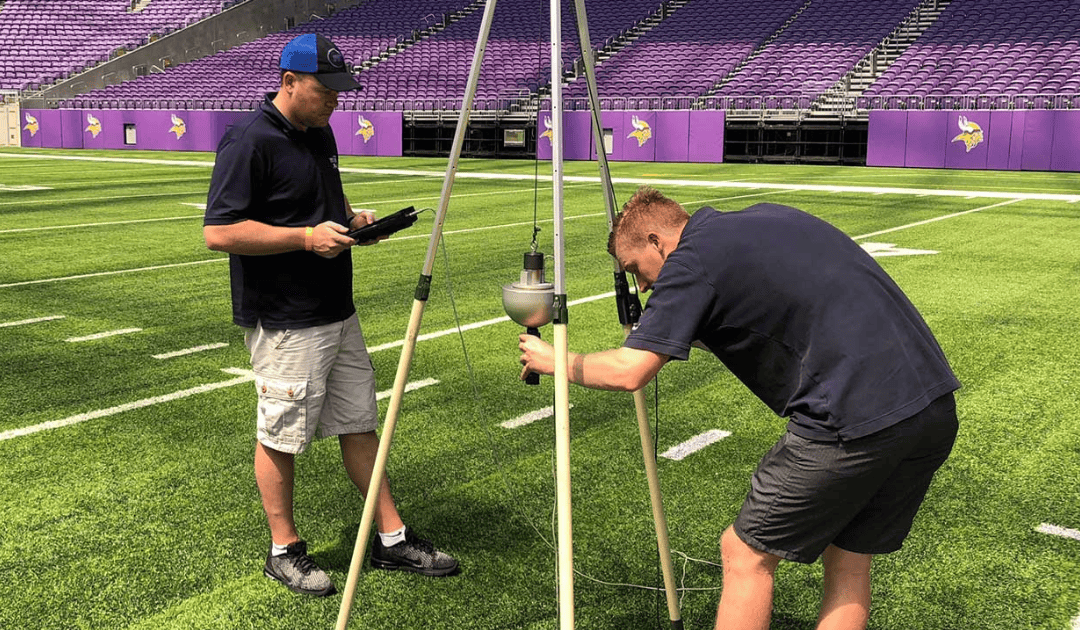
Certification is awarded to a complete installed system, turf, infill, shock pad, and base construction together not to a rolled product in isolation. Testing is conducted by FIFA-accredited independent labs, both in a controlled laboratory setting and on-site at the installed field, and typically covers:
- Ball roll and rebound. How consistently and predictably the ball behaves on the surface.
- Shock absorption and vertical deformation. The same underlying properties covered in our Gmax and Vertical Deformation articles.
- Rotational resistance. Traction and release characteristics.
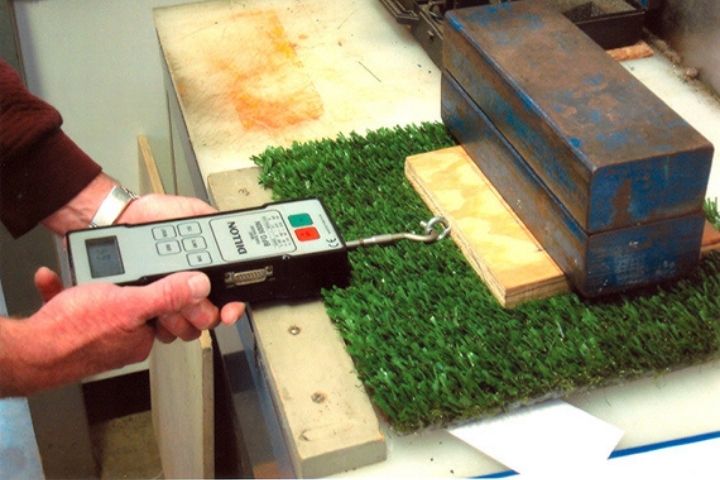
- Durability and abrasion resistance. Simulated wear testing, including Lisport cycle testing.
- Surface temperature considerations. Though certification does not guarantee a cool playing surface; that remains governed by the factors covered in our Surface Heat & Temperature article, independent of certification tier.
How Certification Works – and Why It’s Time-Limited
FIFA Quality certification is not permanent. It is awarded for a defined period (commonly cited as three years) and applies to the specific installed system at a specific location — not to a manufacturer’s product line broadly, and not indefinitely. A field that was certified when installed can fall out of current certification over time as the system ages, unless it is retested and reconfirmed.
This is directly relevant to how field owners should read certification claims: a badge or logo referencing FIFA certification is only meaningful if it reflects an active, current certification for that specific field, not a certification that applied at some point in the past. FIFA maintains a public database of currently certified fields and products for exactly this reason, and we’d encourage anyone evaluating a certification claim, ours or any manufacturer’s, to verify current status directly through FIFA’s official Quality Programme resources rather than relying on marketing material alone.
Why This Matters for Field Owners
FIFA certification is a useful, independently verified data point, but it’s one input among several, not a complete safety and performance picture on its own. A currently certified system tells you it passed a defined set of tests at a point in time; it doesn’t tell you how that same field is performing today, several years and thousands of hours of use later. The lifecycle consistency principles covered throughout this Technical Metrics Library, maintenance cadence, periodic re-testing, infill consistency, apply just as much to a FIFA-certified field as to any other.
Frequently Asked Questions
What’s the difference between FIFA Quality and FIFA Quality Pro?
FIFA Quality is designed for community, school, and municipal fields with higher weekly play volume and a softer surface. FIFA Quality Pro is designed for professional and international competition, with stricter testing and greater durability requirements.
Is FIFA certification permanent?
No. Certification is awarded for a defined period (commonly three years) and applies to a specific installed system at a specific field, it requires retesting to remain current.
Does FIFA certification guarantee a specific field will always perform to that standard?
No. Certification reflects performance at the time of testing. Ongoing performance depends on maintenance, usage volume, and periodic re-testing, the same lifecycle factors that affect any synthetic turf system.
How can I verify if a specific field is currently FIFA certified?
FIFA maintains a public database of currently certified fields and products through its official Quality Programme resources, this is the most reliable way to confirm active certification status rather than relying on marketing materials
Related Resources
Bringing Science to the Surface™, Act Global

by Vincent Garcia
Safety Doesn’t End at Installation — It’s a Lifecycle Question
A synthetic turf field that tests perfectly on installation day can still become inconsistent, harder, or less safe over time without proper maintenance. This is one of the most consistent themes across the research in this library: field condition, not just surface category, is one of the strongest predictors of both performance and injury outcomes. Maintenance is not a cosmetic afterthought — it’s how a field’s day-one performance is preserved for years two, five, and beyond.
What Synthetic Turf Maintenance Actually Involves
- Grooming and brushing — keeping fibers upright and infill evenly distributed, which directly affects traction consistency and ball roll.
- Infill redistribution and top-up — infill migrates toward low points and high-traffic areas over time (goal mouths, hash marks, center circles) and gradually compacts, both of which change how the surface performs if not corrected.
- Decompaction — periodically loosening compacted infill to restore shock absorption and drainage performance.
- Debris removal — clearing organic matter, litter, and contaminants that can affect drainage and create uneven footing.
- Seam and inlay inspection — checking that seams, logos, and line markings remain properly bonded, since a lifting seam is both a performance and a trip-hazard issue.
- Drainage system checks — confirming the sub-base drainage system remains clear and functional, since a compromised drainage system affects both playability and, per the research covered in our Surface Heat article, can compound heat retention.
How Performance Degrades Without Maintenance
Neglected maintenance doesn’t just make a field look worn — it measurably changes the same performance properties covered throughout this library:
- Compacted, unrenewed infill tends to increase surface hardness over time, which can push Gmax readings toward or past recommended thresholds — the same metric associated with impact injury risk.
- Matted, worn fibers change traction characteristics, potentially altering a system’s rotational resistance profile from what it tested at on installation day.
- Uneven infill distribution recreates the same kind of inconsistent footing that affects poorly maintained natural grass — the exact problem synthetic turf is meant to solve when properly maintained.
- Clogged or degraded drainage leads to water pooling, which affects both playability and can create slip hazards.
In short: an unmaintained synthetic field can, over time, develop many of the same inconsistency problems associated with poorly maintained natural grass — undermining the core performance advantage a well-engineered system is designed to provide.
Building a Realistic Maintenance Program
Maintenance frequency should scale with usage volume, not follow a fixed generic calendar. A field used by a single high school team a few days a week has very different needs than a multi-sport municipal complex in use daily. As a general framework:
- Routine grooming and debris removal should happen on a regular, frequent cycle for any actively used field.
- Deep cleaning and decompaction should occur on a periodic schedule, timed around peak usage seasons.
- Infill depth checks and top-up should be part of an annual review, since gradual compaction and migration happen continuously, not in a single noticeable event.
- Professional re-testing (Gmax, infill depth, seam integrity) should occur at defined intervals over the system’s warranty period, not just at installation — this is the same lifecycle testing principle covered in our article for architects and engineers.
Field owners should request a specific, written maintenance plan from their turf provider at the time of purchase — not a general recommendation — tailored to their actual expected usage volume and climate.
Budgeting for Maintenance Is Budgeting for Safety
Maintenance cost is frequently underestimated during the initial budgeting process for a synthetic turf project, but it should be treated as a required line item over the system’s full lifecycle, not an optional add-on. The cost of a consistent, proactive maintenance program is reliably lower than the cost of premature field replacement or the liability exposure of a field that degrades below safe performance thresholds unnoticed. Facility budgets should account for both routine maintenance and periodic professional re-testing across the expected life of the system.
Frequently Asked Questions
Does synthetic turf need maintenance?
Yes. Grooming, infill redistribution, decompaction, debris removal, and drainage checks are all required to preserve a system’s original safety and performance characteristics over time.
Can poor maintenance make synthetic turf less safe?
Yes. Neglected maintenance can increase surface hardness (Gmax), alter traction (rotational resistance) characteristics, and create uneven footing — some of the same safety concerns associated with poorly maintained natural grass.
How often should a synthetic turf field be professionally re-tested?
Re-testing should occur at defined intervals across a system’s warranty period, not only at installation — the appropriate frequency depends on usage volume and should be specified in the maintenance plan from the turf provider.
Is turf maintenance expensive compared to natural grass?
Maintenance requirements and costs differ by surface type rather than one being categorically cheaper. Synthetic turf maintenance should be budgeted as a required, ongoing line item — not skipped — since it directly affects both performance and long-term safety.
Related Resources
Bringing Science to the Surface™ — Act Global
by Vincent Garcia
Infill Isn’t an Afterthought — It’s a Core Specification Decision
Infill is one of the most consequential, and most under-discussed, decisions in a synthetic turf system. It affects how a field feels underfoot, how it manages heat, how it drains, how long it lasts, and how much maintenance it requires — and there is no single “correct” infill for every project. This article breaks down the main infill categories, what each trades off, and how to think through the decision for a specific field.
What Infill Actually Does
Infill sits between the synthetic fibers, providing weight to hold the turf backing in place, cushioning that contributes to shock absorption, and support that keeps fibers upright for consistent ball roll and footing. Infill type and depth directly influence a system’s Gmax (impact attenuation), rotational resistance (traction), and vertical deformation performance — the core metrics covered elsewhere in this library.
The Main Infill Categories
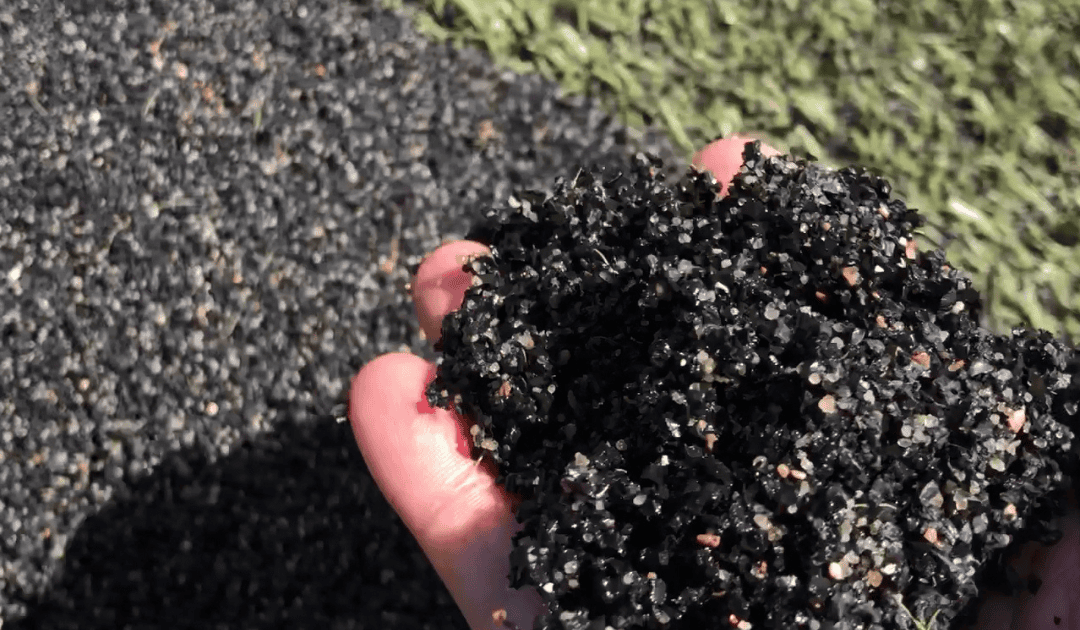
- Styrene Butadiene Rubber (SBR) — recycled rubber infill. The most widely used infill category, valued for cost-effectiveness, durability, and well-established performance data. Tends to run warmer in direct sun than some alternatives.
- Thermoplastic Elastomer (TPE). A synthetic alternative to SBR, generally lighter in color and measurably cooler in direct sun, with consistent, engineered particle size. Typically carries a higher material cost than SBR.
- Organic infills (cork, coconut fiber, and blends). Plant-based alternatives, often marketed on renewability and biodegradability. Performance and longevity vary by product and climate — organic infills can be more sensitive to moisture retention and decomposition over time than mineral or synthetic options.
- Sand. Often used in combination with other infill types (sand-and-rubber, sand-and-organic systems) to add weight and stability at lower cost, particularly common in landscape and lower-intensity applications.
- Coated/encapsulated infill systems. Rubber or other infill particles coated with a polymer layer, designed to reduce dust, odor, and particle migration while aiming to retain the performance characteristics of the base material.
Performance Tradeoffs by Priority
- If heat management is the top priority: TPE and cool-climate infill/fiber technologies consistently test cooler than standard SBR in direct sun — see our full breakdown in Surface Heat & Temperature.
- If budget and proven long-term performance data are the top priority: SBR remains the most extensively tested and cost-effective option, with decades of installed field history.
- If renewability/plant-based sourcing is a program priority: Organic infills offer that positioning, with the tradeoff of more climate- and maintenance-sensitive performance.
- If dust, odor, or particle migration is a community concern: Coated/encapsulated systems are designed specifically to address that, generally at a higher cost than uncoated infill.
Environmental Considerations at a Glance
Infill composition is also one of the most publicly scrutinized aspects of synthetic turf, particularly around tire-derived rubber infill. We’ve covered the most comprehensive federal exposure research on this topic — the EPA/ATSDR Federal Research Action Plan — in our Research Library, including what it found and what it didn’t establish. A full treatment of sourcing, recyclability, and end-of-life considerations for each infill category lives on our Environment hub, which is currently in development.
What Field Owners Should Ask When Choosing Infill
- What is our climate and typical sun exposure — is heat a primary concern for our usage schedule?
- What is our maintenance capacity — can we support an infill type with specific upkeep requirements?
- What is our budget, both for installation and for infill replenishment over the system’s lifecycle?
- Are there specific community concerns (dust, odor, sourcing) that should factor into the decision?
- What independent performance and safety testing data is available for the specific infill product being proposed — not just the infill category in general?
Frequently Asked Questions
What is the most common synthetic turf infill?
Styrene Butadiene Rubber (SBR), a recycled rubber infill, is the most widely used option due to its cost-effectiveness, durability, and extensive performance history.
Which infill runs coolest in the sun?
Thermoplastic Elastomer (TPE) and cool-climate infill technologies have tested measurably cooler than standard SBR rubber infill in direct sunlight.
Is organic infill a good alternative to rubber?
Organic infills like cork and coconut fiber offer plant-based, renewable sourcing, but can be more sensitive to moisture and climate conditions than mineral or synthetic infills, which can affect long-term performance and maintenance needs.
Does infill choice affect field safety?
Yes. Infill type and depth influence Gmax (impact attenuation), rotational resistance (traction), and vertical deformation — all core safety and performance metrics for a turf system.
Related Resources
Bringing Science to the Surface™ — Act Global
by Vincent Garcia
Specifiers Need Data, Not Marketing Claims
Architects, engineers, and facility planners evaluate synthetic turf differently than the general public — and differently than most turf marketing is written for. A specifier isn’t asking “is turf good?” They’re asking whether a specific system meets defined, testable performance criteria, whether that performance can be independently verified before and after installation, and whether the manufacturer can document it. This article covers what that evaluation process actually involves.
Performance-Based Specifications vs. Naming a Single Product
Most public and institutional projects (schools, municipalities, parks departments) are required to write performance-based specifications rather than naming a single proprietary product — meaning the spec defines the performance criteria a system must meet (impact attenuation range, infill depth, drainage rate, fiber height and density, etc.) and any manufacturer whose system meets those documented criteria can bid. This protects the owner from being locked into a single supplier and puts the burden of proof on the manufacturer to demonstrate their system meets the stated criteria with independent test data — not on the specifier to take a sales claim at face value.
The ASTM Standards That Govern Synthetic Turf Testing
Synthetic turf performance is governed by a defined set of ASTM International standards, developed and maintained by ASTM Committee F08 on Sports Equipment, Playing Surfaces, and Facilities. The standards most relevant to specification and testing include:
- ASTM F1936 — Specification for Impact Attenuation of Turf Playing Systems as Measured in the Field (the Gmax standard).
- ASTM F1551 — Comprehensive Characterization of Synthetic Turf Playing Surfaces and Materials, covering a range of test methods used for quality control, acceptance testing, and research.
- ASTM F2765 — Specification for Total Lead Content in Synthetic Turf Fibers.
- ASTM F3188 — Specification for Extractable Hazardous Metals in Synthetic Turf Infill Materials.
These standards define both the test methodology and, in several cases, the maximum or minimum performance thresholds a system must meet. A specifier’s role is to reference the applicable standards directly in the project documents and require submittal of test data demonstrating compliance — not to rely on a general safety claim.
Drainage and Sub-Base Design — An Engineering Problem, Not Just a Turf Problem
Surface performance depends heavily on what’s underneath it. Sub-base design — aggregate depth and grading, compaction standard, and slope — determines how well a field drains and how consistently it performs over its lifecycle. Poor sub-base engineering is one of the most common causes of premature field failure, regardless of how good the turf system installed on top of it is. Specifiers should require documented drainage rate testing and compaction verification (commonly referenced to a Standard Proctor compaction target) as part of the submittal and inspection process, not just turf-level performance data.
What a Complete Submittal Package Should Include
- Pre-installation lab testing from an accredited independent lab (Act Global uses Firefly Sports Testing, Labosport, and Sports Labs) verifying the system meets the specified performance criteria under laboratory conditions.
- Post-installation field verification testing, confirming the system performs to spec once actually installed on-site — laboratory results and field results can differ based on installation quality and sub-base conditions.
- A defined re-testing schedule at intervals appropriate to expected usage volume, since performance properties like impact attenuation and infill depth change over a system’s lifecycle.
- Chain of testing documentation that identifies the specific lab, test method, standard referenced, and date — not just a summary claim.
This is also why Act Global structures its Test Report Center around full methodology transparency — what was tested, by whom, under which standard, and how results compare to the applicable threshold — rather than a simplified pass/fail badge.
What This Means for a Project Team
For architects and engineers, the practical takeaway is to treat synthetic turf specification the same way you’d treat any other performance-critical building system: define measurable criteria, reference the governing standards directly, require independent verification at both the submittal and post-installation stages, and build periodic re-testing into the facility’s long-term maintenance plan rather than treating installation-day testing as the final word.
Frequently Asked Questions
What ASTM standards apply to synthetic turf?
Key standards include ASTM F1936 (impact attenuation / Gmax), ASTM F1551 (comprehensive characterization test methods), ASTM F2765 (lead content in fibers), and ASTM F3188 (extractable hazardous metals in infill materials), among others maintained by ASTM Committee F08.
Should a specification name a specific turf brand?
Most public and institutional projects use performance-based specifications that define required criteria rather than naming a single product, allowing any manufacturer that can document compliance to bid.
Why does sub-base design matter for turf performance?
Sub-base aggregate depth, compaction, and slope directly affect drainage and long-term surface consistency. Poor sub-base engineering is a common cause of premature field failure, independent of turf system quality.
What should a complete turf test submittal include?
Pre-installation lab testing from an accredited independent lab, post-installation field verification testing, a defined re-testing schedule, and documentation identifying the specific lab, method, and standard used for each test.
Related Resources
Bringing Science to the Surface™ — Act Global
by Vincent Garcia
The Real Question Isn’t “Which Surface Is Better” — It’s “Which Surface Stays Consistent”
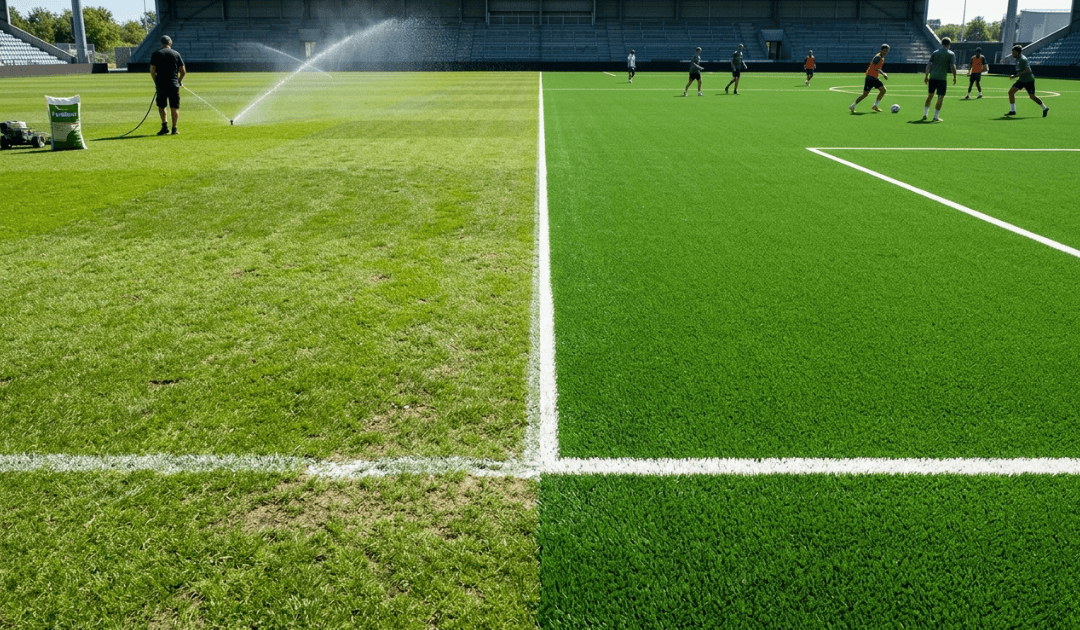
Most public debate about synthetic turf versus natural grass frames it as a binary choice between two fixed categories — as if every synthetic field performs identically, and every grass field performs identically. In practice, the research consistently points somewhere else: field condition and consistency — not surface category alone — is one of the strongest drivers of both playability and safety outcomes. A well-built, well-maintained field of either type outperforms a poorly built or poorly maintained field of the same type. The more useful question for anyone evaluating a surface isn’t “turf or grass,” but “how consistent will this specific field be, play after play, season after season?”
Natural Grass Is Inherently Variable by Nature
Natural grass is a living system, and that’s both its appeal and its central operational challenge. Grass fields change with weather, season, temperature, and moisture. High-traffic zones — center of the field, in front of goals, the hash marks — wear down faster than the rest of the surface under repeated use, creating exactly the kind of uneven footing and inconsistent traction that increases injury risk. A grass field can play firm and predictable in April and be a soft, uneven mess in a rainy November, without a single change to the surface itself. None of this is a flaw unique to any particular grass field — it’s the nature of a living surface, and it’s precisely why grass field quality varies so widely by budget, climate, and groundskeeping resources.
What Engineered Consistency Actually Looks Like
A well-built synthetic system is designed to solve for the variable that grass can’t control: uniformity. That shows up in several measurable ways:
- Consistent Gmax across the entire field. Not just at a single test point, but from sideline to sideline and end zone to end zone.
- Uniform infill depth and distribution. Infill that migrates, compacts unevenly, or thins out in high-traffic areas creates the same kind of inconsistent footing that plagues worn grass, which is why infill consistency is one of the categories evaluated under emerging professional-level testing standards.
- Stable vertical deformation and shock absorption. A field that plays the same in the areas used most (goal mouths, hash marks) as it does in the areas used least.
- Weather-independent performance. A properly drained synthetic system plays similarly whether it rained an hour ago or not, removing one of the largest variability factors in natural grass.
None of this happens automatically just because a surface is labeled “synthetic turf.” It’s a function of system design, installation quality, and infill specification, the same engineering categories covered throughout this Research and Technical Metrics library.
Why a Single Test Result Isn’t the Full Picture
Installation-day testing is necessary, but it’s a snapshot, it tells you how a field performs on day one, under ideal conditions. It doesn’t tell you how that field will perform after 6 months of heavy use, two seasons of weather exposure, or inconsistent maintenance. This is true of both surface types: a grass field can pass every quality standard at seeding and still degrade unevenly by mid-season; a synthetic field can test perfectly at installation and still develop inconsistent infill distribution or matting in high-traffic zones without a proper maintenance program.
This is why Act Global treats consistency as a lifecycle question, not just an installation-day one, covered in more depth in our companion article on maintenance and lifecycle field safety.
What Field Owners Should Actually Ask
Rather than asking “is turf safer than grass,” field owners are better served asking questions that get at consistency directly:
- Is performance data available across multiple points on the field, not just a single test location?
- What infill and maintenance program is required to preserve consistency over the system’s lifecycle, and is that program realistic given our budget and staff?
- How does this system’s performance hold up under our specific climate and usage volume?
- What does re-testing look like after year one, three, and five, not just at installation?
Frequently Asked Questions
Is synthetic turf always more consistent than natural grass?
Only if it’s properly designed, installed, and maintained. Consistency is a function of system quality and upkeep, not something that comes automatically with the material choice, a poorly maintained synthetic field can develop the same kind of uneven, inconsistent footing that affects worn natural grass.
Why does natural grass wear unevenly?
High-traffic areas of a grass field, like goal mouths and hash marks, experience more repeated stress than the rest of the surface, causing faster wear in those zones. Weather, season, and moisture also change how a grass field plays over time, independent of usage.
Does a single installation-day test guarantee long-term field consistency?
No. Installation testing shows how a field performs on day one. Long-term consistency depends on ongoing maintenance and periodic re-testing, for both synthetic and natural surfaces.
What should I ask a turf provider about consistency?
Ask for performance data from multiple points across the field (not a single test location), the maintenance program required to preserve that performance, and how the system is expected to perform under your specific climate and usage volume.
Related Resources
Bringing Science to the Surface™ — Act Global
by Vincent Garcia
“NFL-Ready” Isn’t a Single Credential – It’s a Set of Measurable Standards
Field owners outside the NFL often ask for “NFL-level turf” as shorthand for the highest quality bar available. But NFL suitability isn’t a single stamp of approval a manufacturer either has or doesn’t have, it’s a combination of specific, measurable performance properties, evaluated through defined testing methods. Understanding what those properties actually are is more useful than looking for a single label, especially since the standards themselves continue to evolve as the league and players’ association refine what they measure.
The NFL and NFLPA Are Actively Raising the Bar
In December 2025, the NFL and the NFL Players Association’s Joint Field Surface Safety and Performance Committee introduced new mandatory playing surface standards, applying to both synthetic and natural grass fields. The standards evaluate surfaces using two purpose-built testing tools: the BEAST (Biomechanical Elite Athlete Shoe-Turf Tester), which simulates player movement to assess traction and rotational behavior, and the STRIKE Impact Tester, which measures how much energy a surface absorbs on contact. Systems are tested against a target range informed by natural grass performance data, with the goal of improving consistency across every NFL field, grass, synthetic, or hybrid.
All 32 teams will be required to use an approved surface by the 2028 season. This is a significant, active shift in how the league defines field quality, and it reflects years of player feedback about inconsistent surface performance across venues.
The Core Performance Metrics Behind Any NFL-Level System
Regardless of which specific testing program a field is evaluated under, the underlying properties that separate a professional-grade turf system from a basic one are consistent:
- Traction and rotational resistance. How predictably the surface releases a cleat during cutting and pivoting movements. Too little release increases lower-extremity injury risk; too much reduces performance.
- Impact attenuation (force reduction and Head Injury Criterion). How much energy the surface absorbs versus returns to the body on contact, whether from a fall, tackle, or footstrike.
- Surface consistency (g-max and vertical deformation). How uniform the surface plays across the entire field, not just at a single test point. Inconsistency between the numbers and the sidelines, or between a field’s center and edges, is one of the most common player complaints.
- Infill consistency. Even distribution and depth of infill across the field, which directly affects how uniformly the surface performs from one location to the next.
Act Global tests every system against these categories through independent labs, including Firefly Sports Testing, Labosport, and Sports Labs, the same class of accredited testing infrastructure referenced throughout this Research Library.
What Players Actually Say – and Why It Matters
Any honest discussion of NFL-level turf has to include the NFLPA’s own player survey data: in the union’s most recent membership survey of roughly 1,700 professional players, 92% said they prefer playing on high-quality natural grass, with only 2% preferring synthetic turf.
We’ve written a full breakdown of what that survey does and doesn’t tell us in What the NFLPA Survey Results Really Mean for Field Safety. The short version: that number reflects a preference and comfort metric, not a direct injury-rate metric, and it points to real, historical inconsistency in how synthetic turf has been built and maintained across the league – not proof that a well-engineered synthetic system can’t close that gap. It’s also exactly the kind of data point a serious turf manufacturer should engage with directly rather than avoid.
What This Means for Fields Outside the NFL
Most organizations building a field aren’t installing an NFL stadium surface, but the same underlying categories apply at any level: traction consistency, impact attenuation, surface uniformity, and infill consistency are what separate a well-engineered system from a generic one, whether it’s a high school stadium or a professional practice facility. Field owners evaluating a synthetic turf project should ask for independent test data in these specific categories, not just a general safety claim, regardless of which manufacturer they’re considering.
Frequently Asked Questions
Is there an official “NFL-certified” turf program?
As of December 2025, the NFL and NFLPA introduced new mandatory playing surface standards evaluated by a Joint Field Surface Safety and Performance Committee, using dedicated traction (BEAST) and impact (STRIKE) testing tools. All NFL stadiums and practice facilities must use an approved surface by the 2028 season. This is a newly established, evolving program.
What does the NFL actually test for in a playing surface?
The current framework evaluates traction and rotational behavior, impact energy absorption, and surface consistency, benchmarked against natural grass performance data.
Do NFL players prefer grass or turf?
In the NFLPA’s most recent survey of approximately 1,700 players, 92% said they prefer natural grass, 6% were indifferent, and 2% preferred synthetic turf.
Does that mean synthetic turf is inherently unsafe for professional play?
No, player preference and documented injury risk are related but distinct questions. The survey reflects comfort and preference; it does not, on its own, establish that well-engineered modern turf systems carry higher injury rates than natural grass across the board. See our full review of the NFLPA survey data for more detail.
What should a non-NFL field owner look for if they want “NFL-level” quality?
Independent test data on traction/rotational resistance, impact attenuation (g-max, HIC, force reduction), surface consistency, and infill consistency, the same underlying categories the NFL evaluates, regardless of the specific certification program involved.
Related Resources
Bringing Science to the Surface™ – Act Global